Valid Trendlines are straight lines drawn on a chart that connect two or more price points, such as higher highs or lower lows, to show the direction of a trend.
In the image below, an uptrend is depicted. A valid trendline is drawn by connecting three instances of higher highs.

In the image below, a downtrend is depicted. A valid trendline is drawn by connecting three instances of Lower Lows.

Why trendline is useful?
In technical analysis, trendlines help identify key support levels (where prices bounce up) and resistance levels (where prices fall). They are also used to draw market patterns like head and shoulders, triple tops, and triple bottoms.
Types of Trendlines
- Uptrend Line: A line drawn upward to the right along successive higher lows. It indicates that the asset’s price is moving upward.
- Downtrend Line: A line drawn downward to the right along successive lower highs. It indicates that the asset’s price is moving downward.
Common Mistakes
- Forcing Trendlines: Avoid forcing a trendline to fit your expectations. If the line doesn’t align naturally with the highs or lows, it’s likely invalid.
- Ignoring Trendline Breaks: When a trendline is broken, it often signals a change in trend. Ignoring this can lead to incorrect predictions.
What is a valid trendline ?
Not every trendline is valid; many can be incorrect and lead to wrong trading decisions. To draw a valid trendline, ensure the price touches the line at least three points. There are various methods to construct a valid trendline, depending on your experience and the type of securities you trade. Choose the one that works best for you.
Validating a Trendline
- Volume Confirmation: Increasing volume when the price approaches and tests the trendline can confirm its validity.
- Time Frame: Trendlines in higher time frames (daily, weekly, monthly) are generally more reliable than those in lower time frames (minutes, hours).
- Consistency: A valid trendline should remain consistent over time, meaning it should hold as a support or resistance level across various periods.
Rules to determine Valid trendline.
A trendline that has been tested more than three times is considered valid, as it indicates a strong trend and acts as good support. Minor breaks in the trendline can happen during intraday or weekly movements. The more the line is tested the more valid is because price is following it.
When a trendline breaks, traders wonder when to take it seriously. If the price moves more than 1% beyond the trendline, it’s usually a significant signal. Some traders prefer waiting for a 2-day close above the trendline on a daily chart. Personally, as an intraday trader, I look for two consecutive losses along with key support and resistance levels, and I use the MACD for a clearer picture. Note that I am not SEBI registered; this blog is for educational purposes only. Please consult your financial advisor.
What To Do When Valid Trendline Breaks ?
When a trendline breaks, traders wonder when to take it seriously. If the price moves more than 1% beyond the trendline, it’s usually a significant signal. Some traders prefer waiting for a 2-day close above the trendline on a daily chart. Personally, as an intraday trader, I look for two consecutive losses along with key support and resistance levels, and I use the MACD ,SIMPLE MOVING AVEREAGE for a clearer picture. Note that I am not SEBI registered; this blog is for educational purposes only. Please consult your financial advisor.
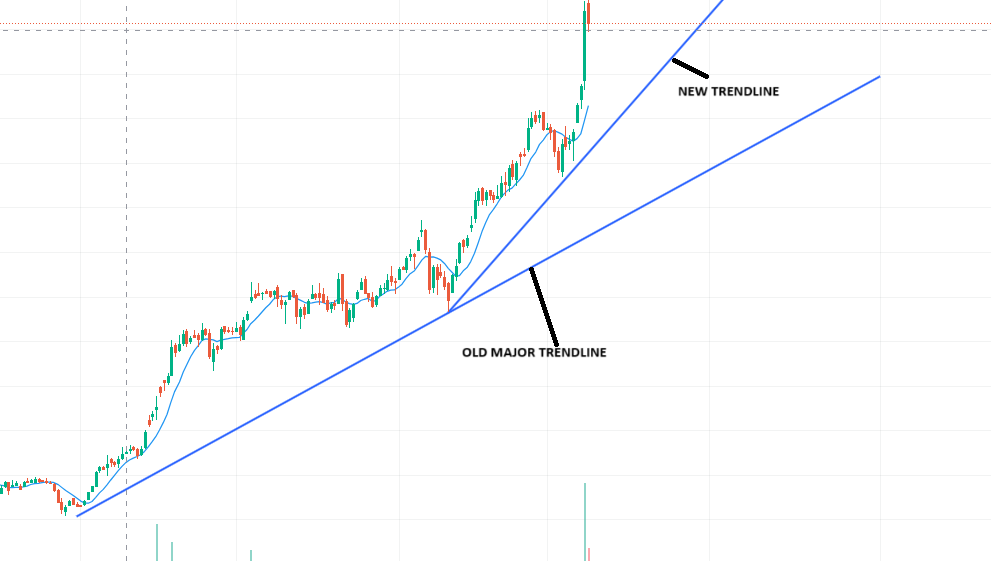
Whenever there is a penetration of trendline , trader should draw a new trendline to follow the trend.

Conclusion
Indeed, trendlines are a crucial aspect of technical analysis in trading and investing. They help identify the general direction of price movements, support and resistance levels, and potential entry and exit points for trades.
Practical Tips
- Combining with Other Indicators: Use trendlines in conjunction with other technical analysis tools like moving averages, RSI, MACD, etc., for more robust predictions.
- Regular Reassessment: Periodically reassess your trendlines as new price data becomes available to ensure they remain valid.
By carefully identifying and drawing valid trendlines, traders can make more informed decisions and improve their ability to predict future price movements.
Note The above written information is only for educational purposes, before making investment choices consult your financial advisor.


Pingback: Head And Shoulder Chart Pattern Analysis – Finspace360