MACD is a popular tool used in trading to understand market trends and make better trading decisions. It is a trend-following indicator that shows the relationship between two moving averages of a stock’s price.
This article will explain what MACD is, how to use it in trading, its limitations, and how it can be combined with the Average Directional Index (ADX) for better results.
What is MACD?
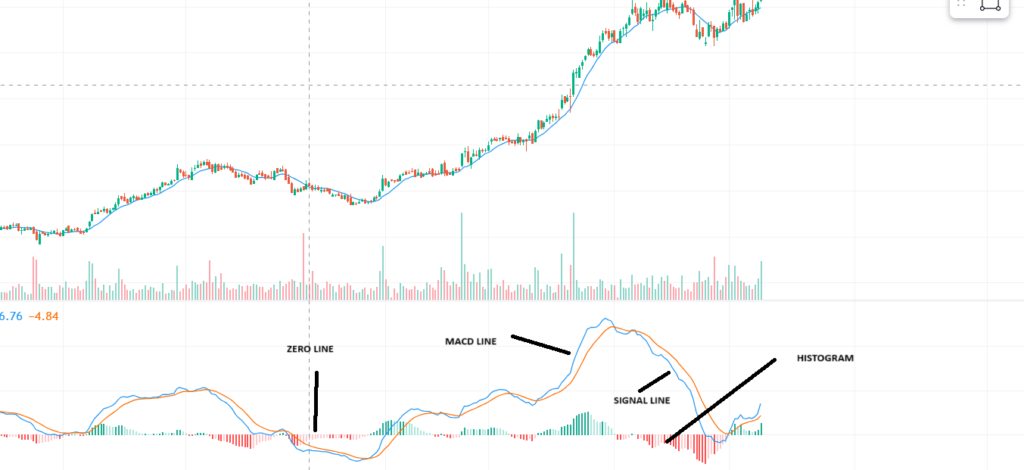
MACD is a popular tool used in trading to understand market trends and make better trading decisions. It is a trend-following indicator that shows the relationship between two moving averages of a stock’s price. It consists of three main components:
1. MACD Line: The difference between the 12-day and 26-day Exponential Moving Averages (EMA).Don’t worry I will explain all theses things shortly.
2. Signal Line: A 9-day EMA of the MACD Line.
3.Histogram: The difference between the MACD Line and the Signal Line.
JUST HAVE A LOOK TO UNDERSTAND VERY CLEARLY THE PARTS OF MACD THROUGH DIAGRAM.

Why are the 26-day and 12-day EMAs Used in MACD?
The choice of using the 26-day and 12-day Exponential Moving Averages (EMAs) to calculate the MACD (Moving Average Convergence Divergence) indicator has
1. Historical Reasons
2. Practical reasons
Historical Reasons
The MACD indicator was developed by Gerald Appel in the late 1970s. At that time, the standard trading periods were often based on monthly and half-monthly cycles:
1. 26-day EMA : This roughly corresponds to a monthly cycle, assuming around 21 trading days in a month. By extending a bit, 26 days captures a longer period, smoothing out more short-term fluctuations and providing a better sense of the overall trend.
2. 12-day EMA : This represents approximately half of a monthly cycle. It responds more quickly to recent price changes compared to the 26-day EMA, allowing traders to see shorter-term trends and potential shifts in the market.
Practical Reasons
The combination of 26-day and 12-day EMAs strikes a balance between sensitivity and reliability:
- Short-term vs. Long-term Trends: Now if you know EMA short term EMA are sensitive while long term EMA are reliable.
The 12-day EMA reacts faster to recent price changes, highlighting short-term trends. The 26-day EMA reacts more slowly, reflecting longer-term trends. By subtracting the 26-day EMA from the 12-day EMA, the MACD line shows the relationship between short-term and long-term trends, helping traders identify potential changes in momentum.
2. Signal Line (9-day EMA): The Signal Line, which is a 9-day EMA of the MACD line, further smooths out the MACD line, providing a clearer signal for buy or sell decisions when crossovers occur.
How MACD Works In Trading
MACD can be used in several ways to make trading decisions:
To decide whether to buy or sell using MACD, you need to understand if the trend is bullish or bearish. To do this, look for three things:
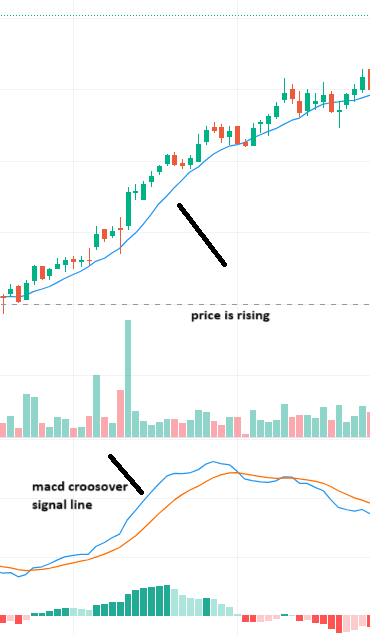
- Crossovers: When the MACD line crosses above the Signal line, it suggests a buy. When it crosses below, it suggests a sell. For example, look price is rising in the below picture,

Sometimes the MACD line will cross the Signal line frequently, giving mixed signals. In such situations, it’s best not to trade.MACD can sometimes give false signals in a volatile market, leading to wrong trading decisions.

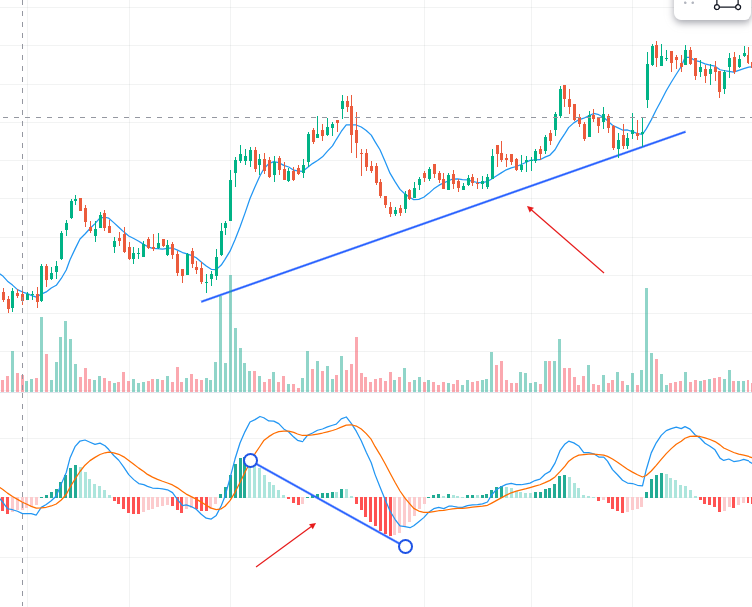
2.Divergence: If the MACD and the price are moving in opposite directions, it could signal a trend reversal. In divergence MACD goes in opposite direction to price. So as given in below photo Price is rising and MACD is falling ,This shows trend reversal is about to happen.

- Zero Line: When the MACD line crosses above the zero line, it indicates a bullish trend. Crossing below the zero line indicates a bearish trend
- Overbought/Oversold Conditions: If the MACD Line is significantly above or below the Signal Line, it can indicate that the stock is overbought or oversold, respectively.
While MACD is a powerful tool, it has some limitations
1. Lagging Indicator : MACD is based on moving averages, which are lagging indicators. This means it reacts to past price movements and may not always predict future trends accurately.
2. False Signals: MACD can sometimes give false signals in a volatile market, leading to wrong trading decisions.
3. Doesn’t Predict Price Levels: MACD indicates the direction and strength of a trend but doesn’t predict the price levels.
Using MACD with ADX
To improve the accuracy of MACD signals, traders often use it in combination with the Average Directional Index (ADX). ADX measures the strength of a trend, helping traders to avoid false signals during weak trends.
How to Combine MACD and ADX
1. Confirming Trends: Use ADX to confirm the strength of a trend before acting on MACD signals. A high ADX value (usually above 20) indicates a strong trend, making MACD signals more reliable.
2. Filtering Trades: When ADX is low, it indicates a weak or sideways trend. In such cases, you might want to avoid trading based solely on MACD signals.

Pingback: What is Relative Strength Index? – Finspace360