In the world of trading, recognizing trend reversals is crucial. Trend reversals are specific price patterns that indicate a potential change in the current market direction.
What Are Trend Reversal Patterns?
But first, let’s clarify what we mean by a trend?
A trend is when prices steadily move up(consistently ascending)) or down (consistently descending), marked by highs and lows. In technical analysis, we use trendlines to identify trends and make informed trading decisions.
Trend reversal patterns are specific formations on stock and commodity charts that hold predictive value. Think of them as road signs on a trading map, guiding traders on when the market might change direction. Some of the most well-known trend reversal patterns include:
- Head and Shoulders
- Triple Top and Bottom
- Double Top and Bottom
- Round Saucer
In this post, we will dive deeply into how to accurately spot these patterns.
The Importance of Trend Reversal Patterns
Understanding and identifying trend reversal patterns is like having a weather forecast for the stock market. They offer several critical benefits:
- Predictive Value: These patterns help forecast future price movements.
- Measuring Value: They provide insights into the extent of the trend reversal.
- Direction Indication: They clearly signal a change in market direction.
- Risk and Reward Assessment: They aid in determining the risk-reward ratio for trades.
- Price Projection: They predict how far the price might move post-reversal.
By mastering these patterns, traders can make informed decisions, minimize risks, and maximize their trading rewards.
In-Depth Analysis of the Head and Shoulders Pattern
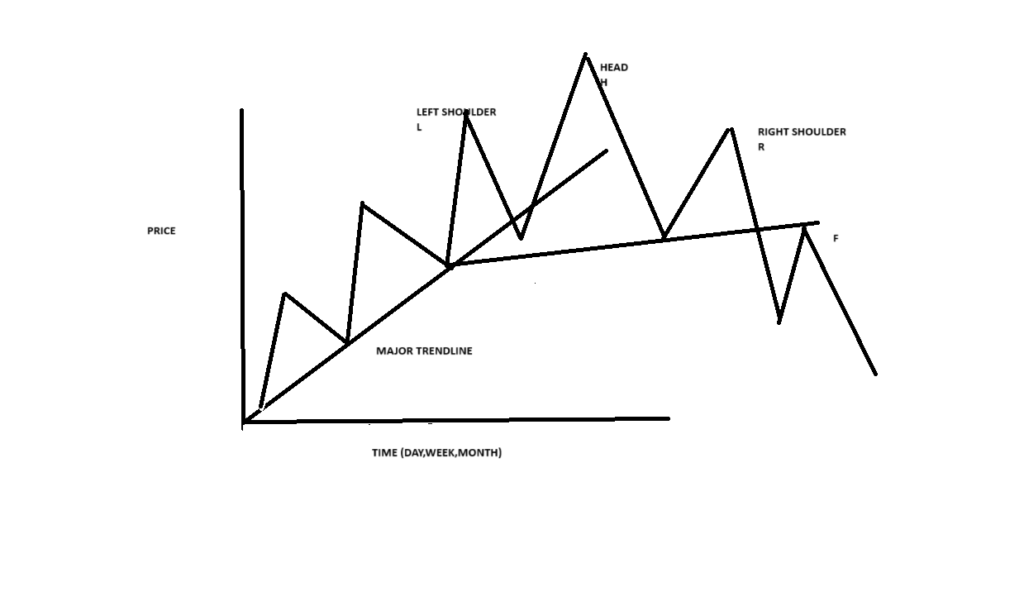
One of the most well-known reversal patterns is the head and shoulders. This pattern resembles a person’s head and shoulders, with two peaks (shoulders) flanking a higher peak (head). Here’s what to watch for:
- Left Shoulder: The market rises to a peak and then falls.
- Head: A higher peak forms, followed by another decline.
- Right Shoulder: The market rises again but only to the level of the first peak, then falls once more.
The neckline, connecting the lows between these peaks, acts as the breaking point. When the price drops below this line, it confirms the reversal, much like a bowstring releasing an arrow, propelling the market in the new direction.
In-Depth Analysis of the Head and Shoulders Pattern
One of the most well-known reversal patterns is the head and shoulders. This pattern resembles a person’s head and shoulders, with two peaks (shoulders) flanking a higher peak (head).
- Left Shoulder: The market rises to a peak and then falls.(Represented by L)
- Head: A higher peak forms, followed by another decline.(Represented by H)
- Right Shoulder: The market rises again but only to the level of the first peak, then falls once more.(Represented by R)
The neckline, connecting the lows between these peaks, acts as the breaking point. When the price drops below this line, it confirms the reversal, much like a bowstring releasing an arrow, propelling the market in the new direction.

Steps to Identify a Valid Head and Shoulders Pattern
Identifying a head and shoulders pattern is crucial for effective trading. Follow these steps to accurately spot this pattern:
Step 1: Identify the Left Shoulder (L)
Start by looking for the left shoulder, marked as “L.” In an uptrend, you typically see higher peaks and higher troughs. The left shoulder will have a peak followed by a retracement to the major trendline, indicating that the market is still moving smoothly.
Step 2: Identify the Head (H)
Next, look for the head, labeled “H.” In a head and shoulders pattern, the volume at the head is usually lighter compared to the previous left shoulder peak. This decrease in volume is a key indicator that the head is forming.
Step 3: Notice the Head’s Retracement
At this stage, the retracement from the head dips below its previous trough. This is a significant sign that a head and shoulders pattern is developing.
Step 4: Identify the Right Shoulder (R)
Now, observe the right shoulder, marked as “R.” The peak of the right shoulder is lower than the head, and its retracement falls below the major trendline. By this point, the trendline should already be broken, as noted in the previous step.
Step 5: Watch for Retracement and Reversal
Sometimes, there might be a retracement; however, most often, the market will reverse at this point, confirming the head and shoulders pattern.
Some Real Stock Market Examples.

By following these steps, traders can accurately identify a head and shoulders pattern, enabling them to make informed trading decisions.
In the next blog we will discuss other chart patterns.
