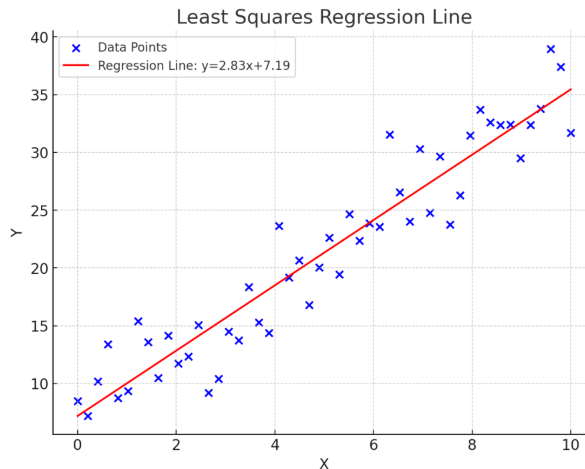
The least square regression line, also called the line of best fit, is a straight line that best represents a set of data points on a graph.
Steps to find least square regression line
The Least Square Method is used to find least square regression line and it provides visual presentation of line of best fit (Least Square Regression Line).
y = mx + b
Symbols like ‘y’ denotes the dependent variable and ‘x’ denotes the independent variable, further ‘m’ represents the slope and ‘b’ denote the intercept.
This line of best fit helps to predict values and show the relationship between two variable. It’s a straight line that best fits your data, minimizing the vertical distance (errors) between the data points and the line.
Steps with example is given below.
- Requirement : The intercept and slope value is needed for least square regression line.
- Collect Data: You need pairs of X (independent variable) and Y (dependent variable) values.
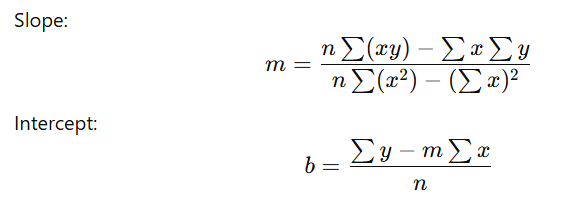
- Formulae:

- We will put the values to find slope and intercept.
Let’s take example of weight predicted on the basis of age.
Age (x) and weight (y) with 5 data points. We’ll calculate the least squares regression line step by step.
- DATA
| Age(x) | Weight(y) |
| 10 | 30 |
| 12 | 35 |
| 14 | 38 |
| 16 | 42 |
| 18 | 45 |
- Calculate Necessary Sums
| x | y | x2 | xy |
| 10 | 30 | 100 | 300 |
| 12 | 35 | 144 | 420 |
| 14 | 38 | 196 | 532 |
| 16 | 42 | 256 | 672 |
| 18 | 45 | 324 | 810 |
Where ∑ denotes the sum of terms for example ∑x = 10 +12 + 14 + 16 + 18 = 70
∑x=70, ∑y=190, ∑x2=1020, ∑xy=2734
n=5(number of data points)
- Calculate Slope (m)

m= 5(2734)−(70)(190) / 5(1020)−(70)^2
m=13670−13300 / 5100−4900
m=370 / 200 = 1.85
- Calculate Intercept (b)

b=190−1.85(70) / 5
b=190−129.55 / 5
b= 60.5 / 5 = 12.1
- Regression Line Equation
y=1.85x+12.1
- Interpretation
Slope (m=1.85): For every 1-year increase in age, the weight increases by approximately 1.85 units.
Intercept (b=12.1): When age is 0 (theoretically), the weight would be 12.1 units.
- Prediction
To predict weight for an age x=15
y=1.85(15) + 12.1 = 27.75 + 12.1 = 39.85
So, at age 15, the predicted weight is approximately 39.85 units.
Least square regression line calculator
Least Squares Line Calculator
Frequently asked Question
What is least square regression line ?
The least squares line, also called the line of best fit, is a straight line that best represents a set of data points on a graph.
Find the least square regression line ?
The Least Square Method is used to find linear square regression line and it provides visual presentation of line of best fit (Least Square Regression Line).

