Alpha and beta: a duo in finance, one for performance, the other for stability. Like yin and yang, they balance risk and reward, guiding investors through the market’s ebb and flow.

If you’re in the stock market for the long haul, searching for top-notch stocks that promise solid returns, then quantitative analysis is your go-to tool. Today, we’re diving into two famous indicators: alpha, the performance gauge, and beta, the volatility meter.
Now, imagine you’re on a quest for those gems in the stock market, the ones that can potentially skyrocket your investment. Well, alpha and beta are like your trusty sidekicks in this adventure.
What is Alpha?
First up, alpha! This little powerhouse measures how well a stock performs compared to what you’d expect based on the market’s movements. In simple terms, it tells you if your investment is outperforming or underperforming the market’s expectations. Picture it like this: you’re aiming for gold, but alpha tells you if you hit platinum status.

In the above picture Bharti Airtel Ltd Alpha is 21.79 which means this particular stock performed 21.7% more then the benchmarks(nifty 50).
Now, onto beta, the volatility indicator. Think of beta as your rollercoaster ride meter. It tells you how much your stock’s price tends to swing in response to the overall market. A beta of 1 means your ride matches the market’s twists and turns. Higher than 1? Hold on tight, because you’re in for a wilder ride. Lower than 1? You’re on the kiddie coaster – smoother, but maybe less thrilling.
What is Beta?
So, whether you’re hunting for those top-quality stocks or just want to understand the ups and downs of your investments, keep alpha and beta in your toolkit. They’re like the Sherlock and Watson of the stock market – helping you uncover the mysteries and make smarter investment moves.

In the above picture Bharti Airtel Ltd Beta is 0.60 which means if market goes up by 1% then this stocks goes up by 0.6%.Similarly if market goes down by 1% then this stocks goes down only by 0.6%.generally stocks with value from 0.5 t0 1.5 are considered good.
How to pick stocks using Alpha And Beta?
Alright, picture this: You’re on a mission to find the best stocks out there, the ones that could really boost your investment game. And guess what? Alpha and beta are your secret weapons in this treasure hunt!
Here’s how you can use them to screen for stocks like a pro, using a handy website called Ticker Tape:
Step 1: Get those filters ready!
– First, apply the P/E ratio filter. This little number tells you how a stock’s value stacks up against its peers. You want to pick companies with reasonable valuations.
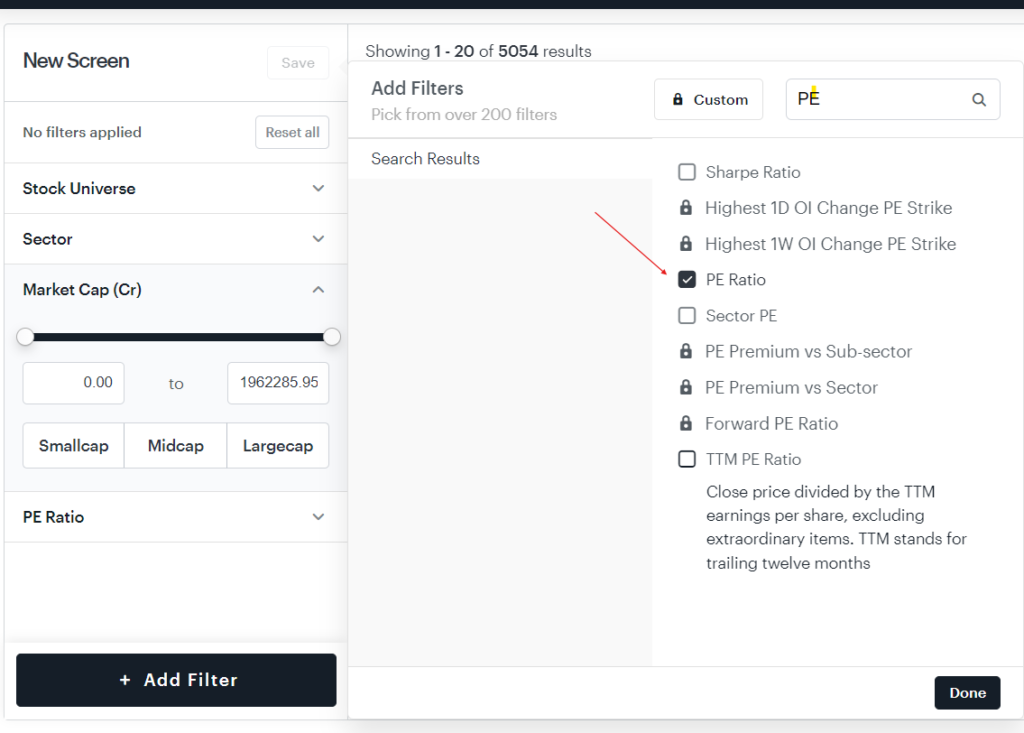
– Next up, revenue. Look for companies with at least five years of revenue history. After all, you don’t want to bet on a company that hasn’t made any money yet!
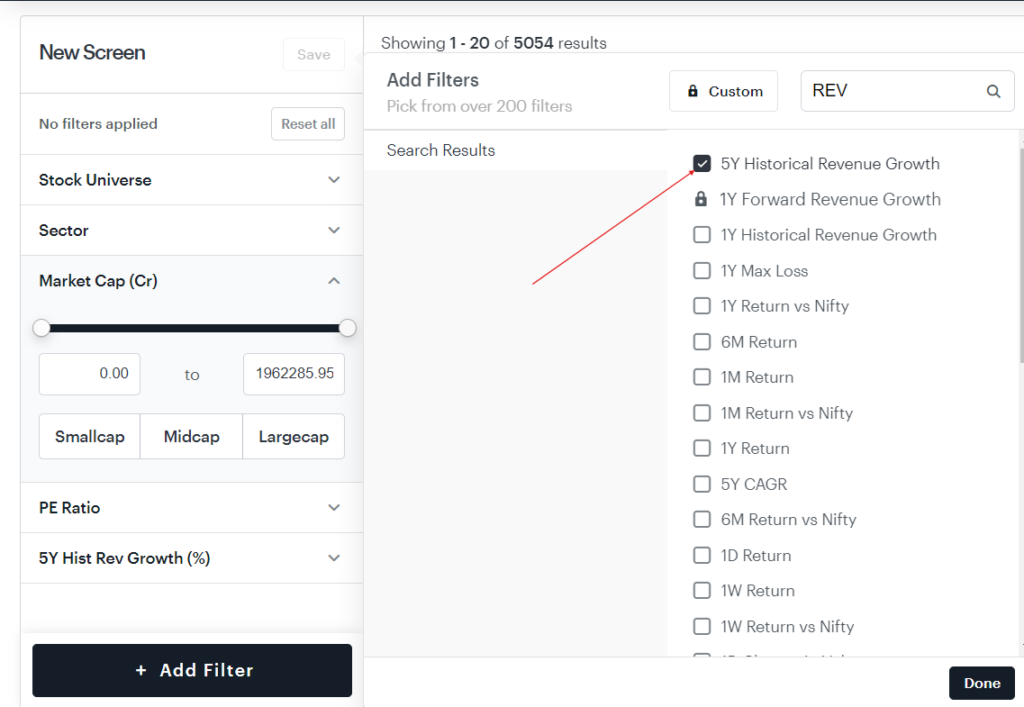
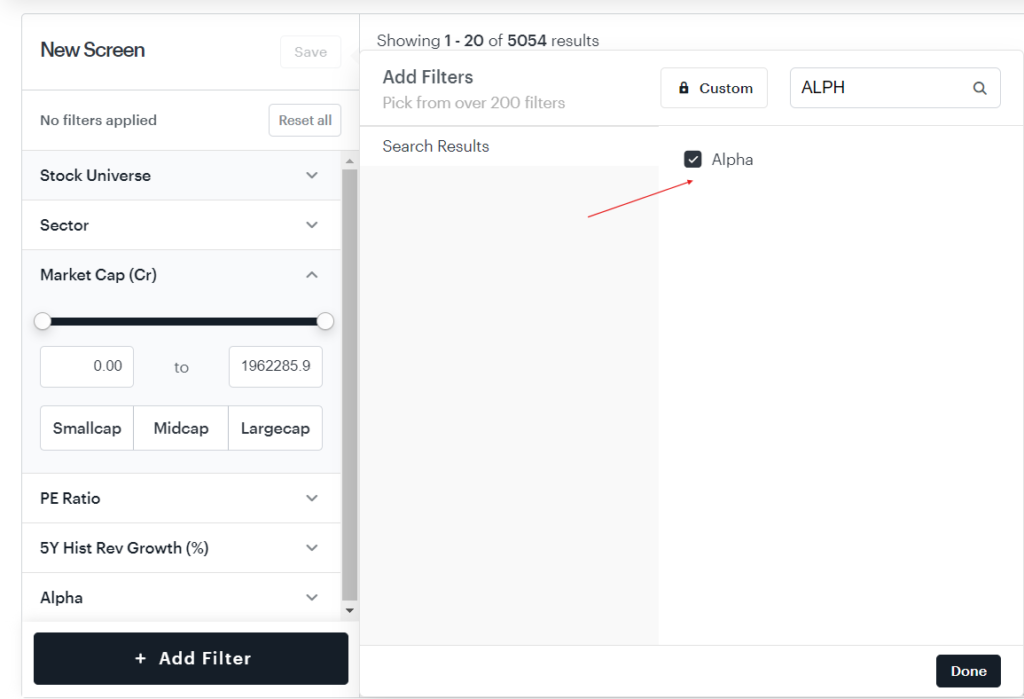
Step 2: Time for alpha!
– Now, select the alpha filter. Alpha is like your performance gauge. You want to pick companies with a healthy alpha – think of it like finding stars in the stock market sky.
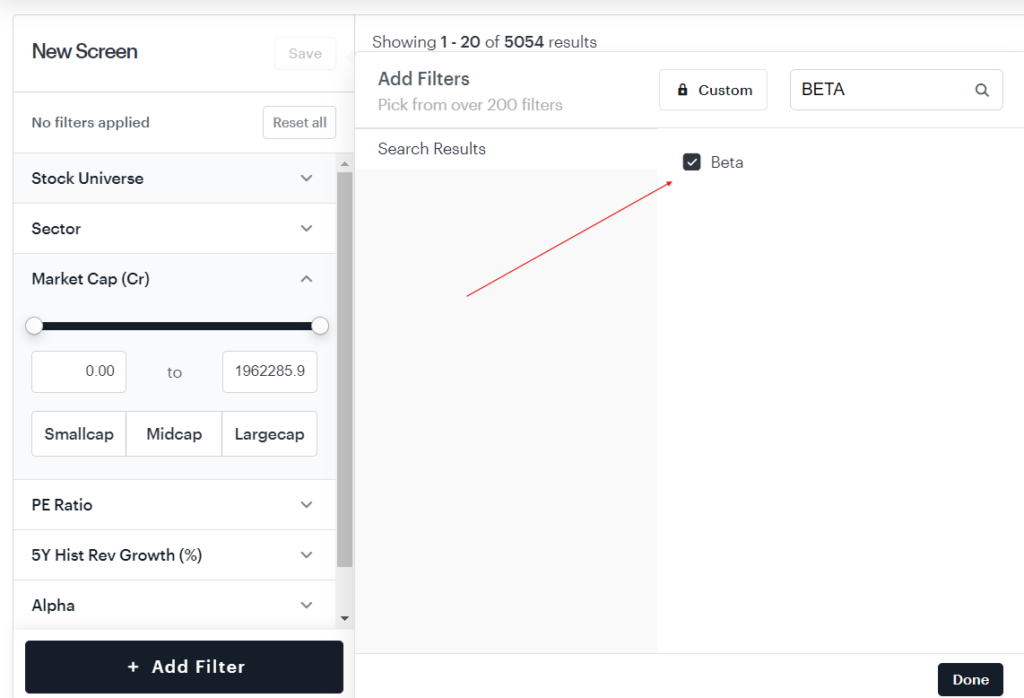
Step 3: Bring on the beta!
– Lastly, choose the beta filter. Beta measures how much a stock’s price bounces around with the market. You’re aiming for stocks with betas in the range of 0 to 1 or 1.5 – not too wild, not too tame.
And there you have it – a list of filtered stocks that could be your next big winners! Keep an eye out for companies with solid alpha and beta scores, and you’ll be well on your way to building a strong investment portfolio. Happy hunting!
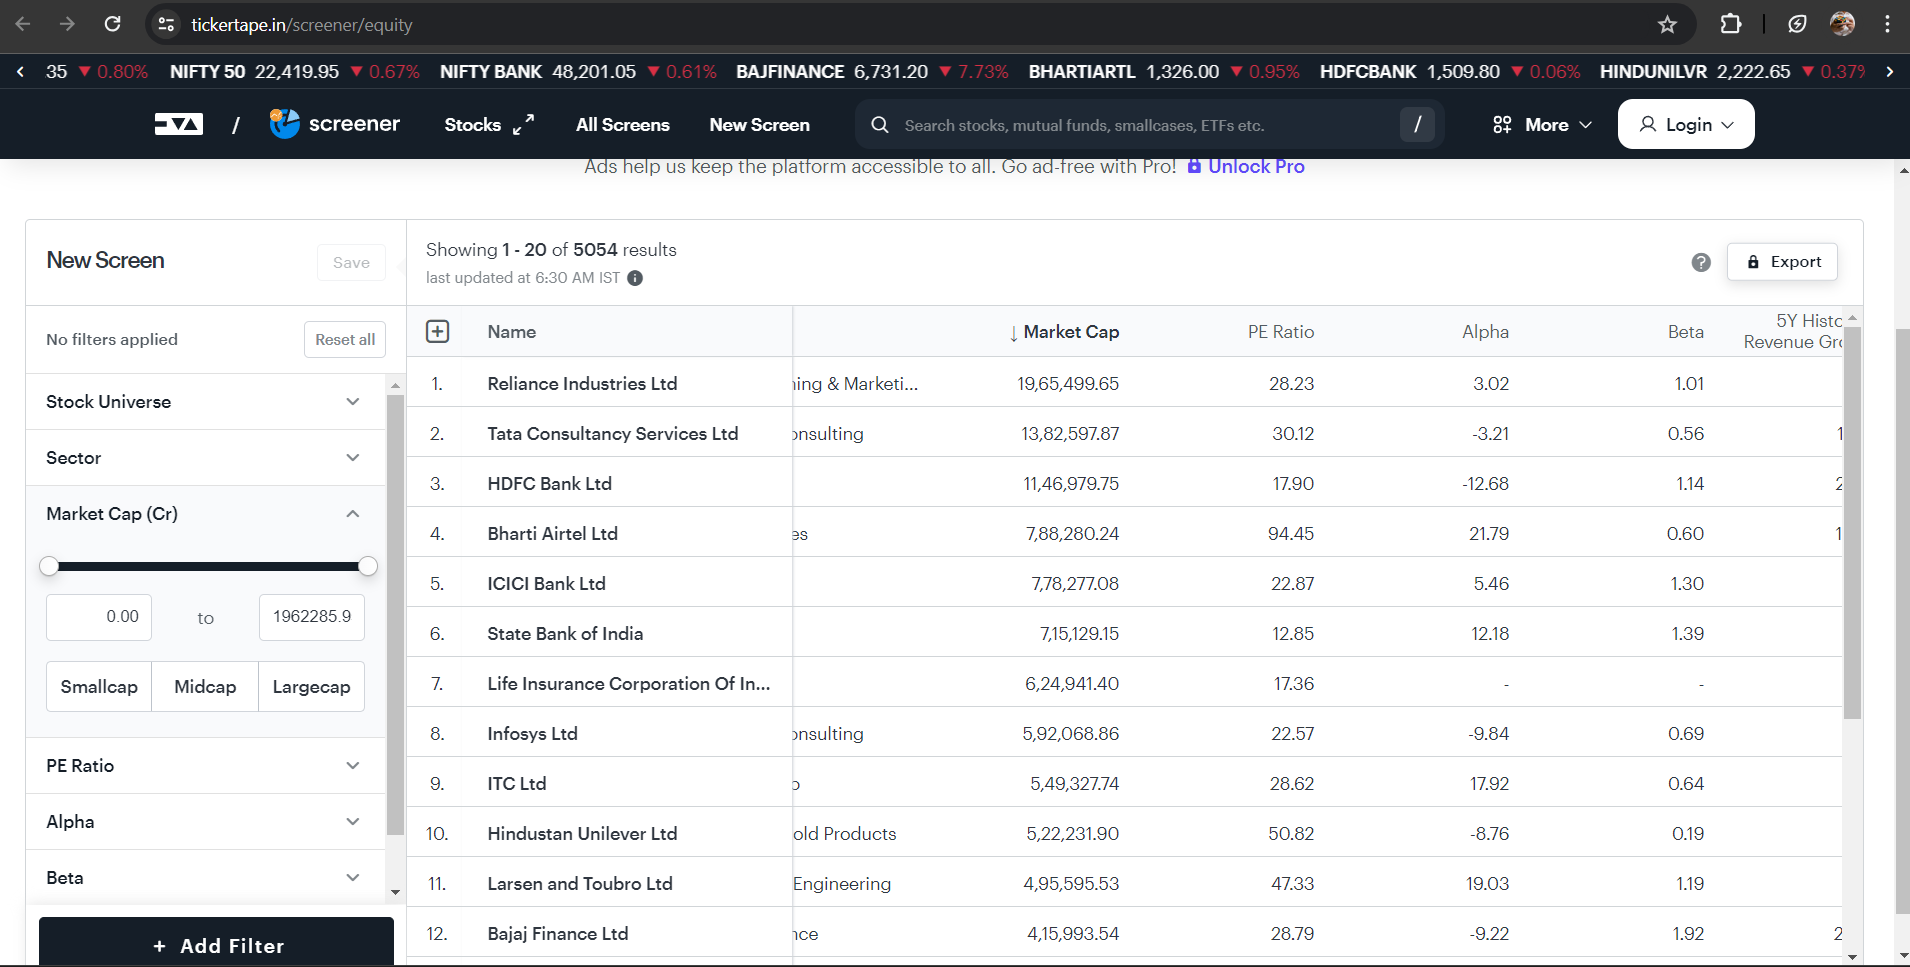
You can also export this results in excel by clicking on top right corner,

calculations of alpha and beta along with the methodologies involved:
1. Alpha Calculation
– The most common method for calculating alpha is through the Capital Asset Pricing Model (CAPM), which is represented by the following formula:
a =(Ri – (Rf + beta * (Rm – Rf))
Where:
a = Alpha
Ri = Return of the investment
Rf= Risk-free rate of return (usually the yield on government bonds)
beta= Beta of the investment
Rm = Return of the market (such as a benchmark index like Nifty 50)
– Alpha is calculated by subtracting the expected return of the investment based on its beta from the actual return of the investment. A positive alpha indicates that the investment outperformed its expected return, while a negative alpha indicates underperformance.
2. Beta Calculation
The beta of an investment is typically calculated using regression analysis. The formula for beta in a simple linear regression model is as follows:
betai = {Covariance}(Ri , Rm)\{Variance}(Rm)
Where:
betai = Beta of the investment
Ri = Return of the investment
Rm = Return of the market
Covariance( Ri , Rm ) = Covariance between the returns of the investment and the market
Variance Rm = Variance of the market returns
– Beta represents the slope of the regression line, which shows how the returns of the investment change for a unit change in the returns of the market. A beta of 1 indicates that the investment’s returns move in line with the market, while a beta greater than 1 implies higher volatility and a beta less than 1 indicates lower volatility.
Note– Before Investing in stock market consult the registered SEBI experts. Markets could be risky.

